METROPOLIS2 Course
Session 6: Input Side of Paris' Simulation
Lucas Javaudin
Spring 2024
Paris' Urban Area Simulation
- Area: Île-de-France (Paris' administrative region, 12.3 M inhabitants, 12,000 km2)
- Period: morning (from 3 a.m. to 10 a.m.)
- Modes: car, public transit and walk
- Purposes: all (home, work, education, leisure, shop, other)
- Scaling: trips and capacities are scaled down to 10 %
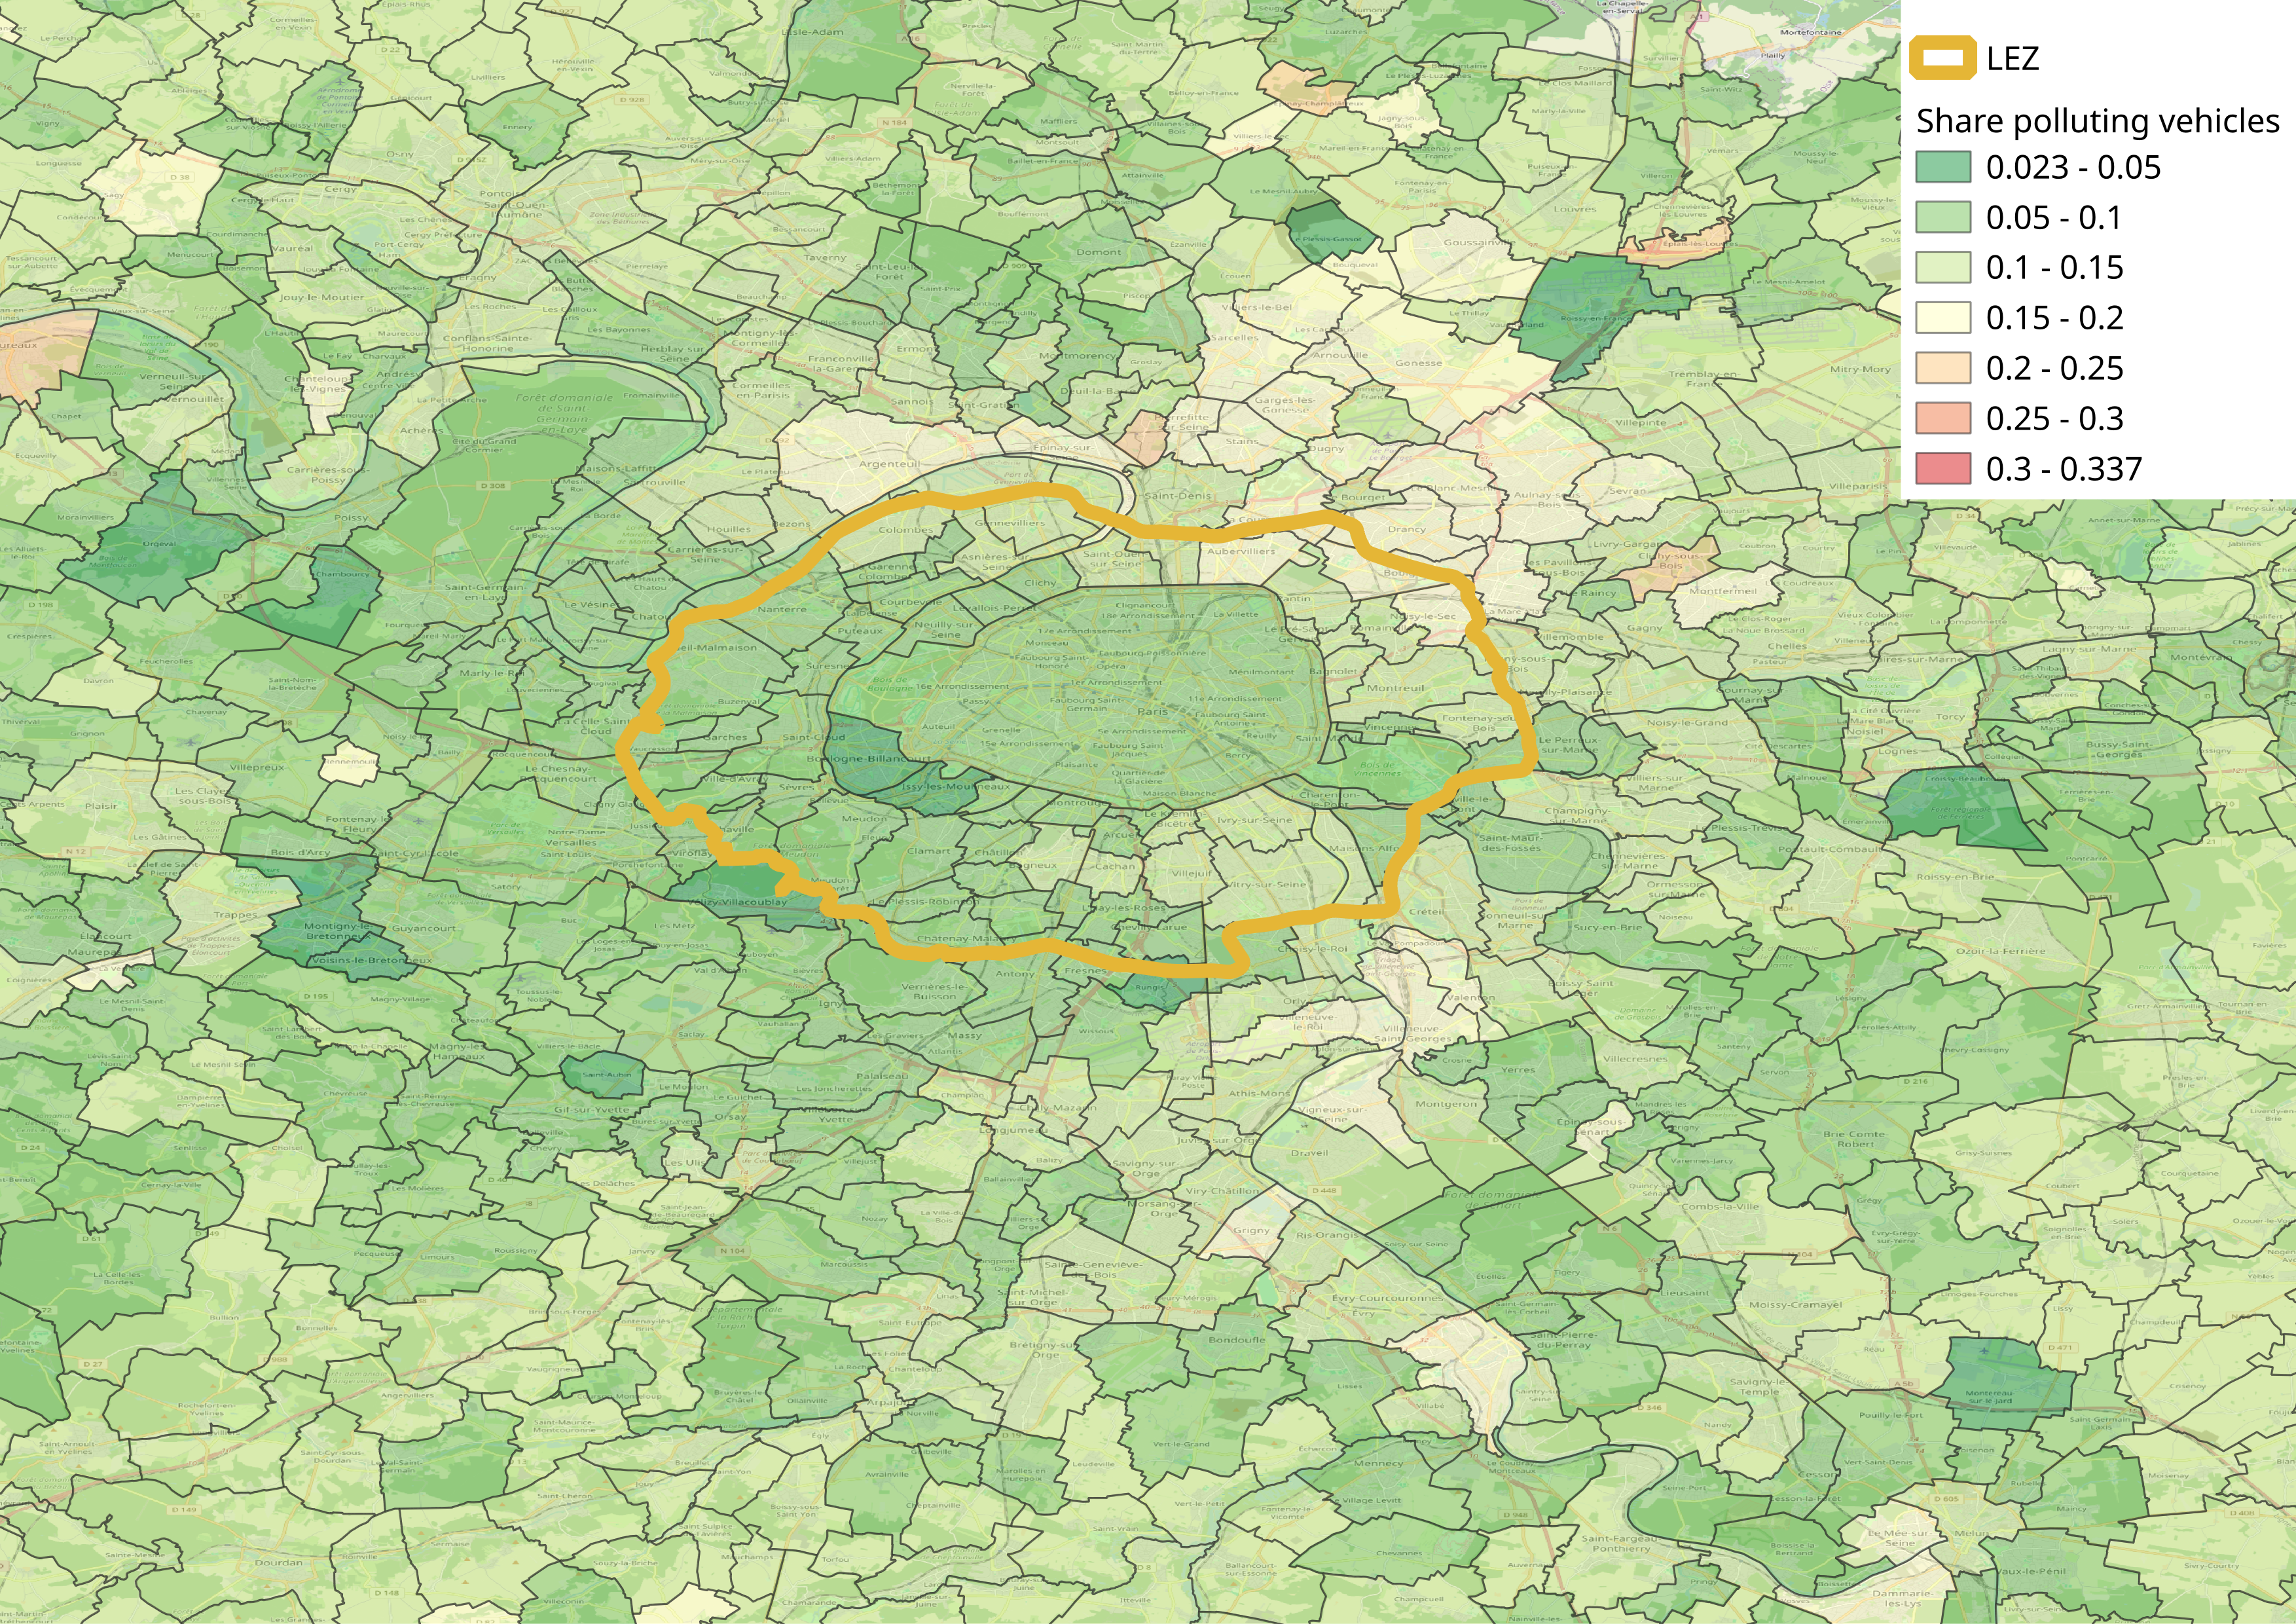
- Application: Low emission zone LEZ (polluting cars are banned from Paris and the inner ring)
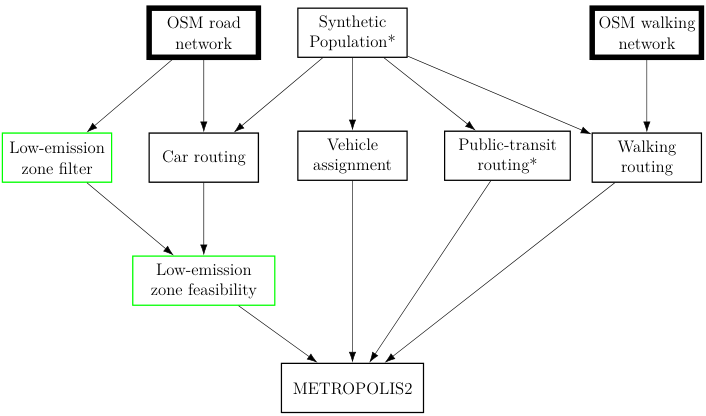
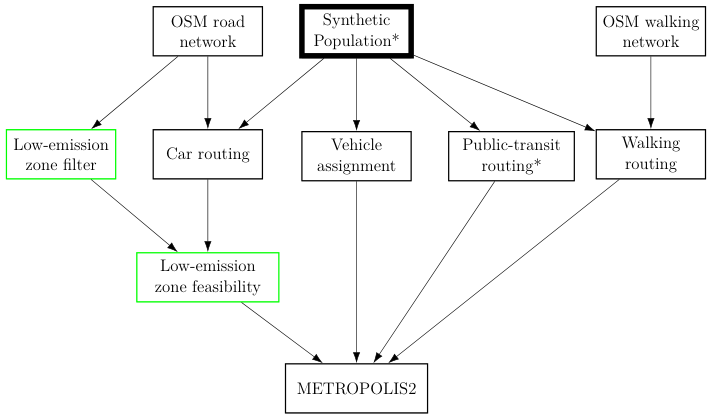
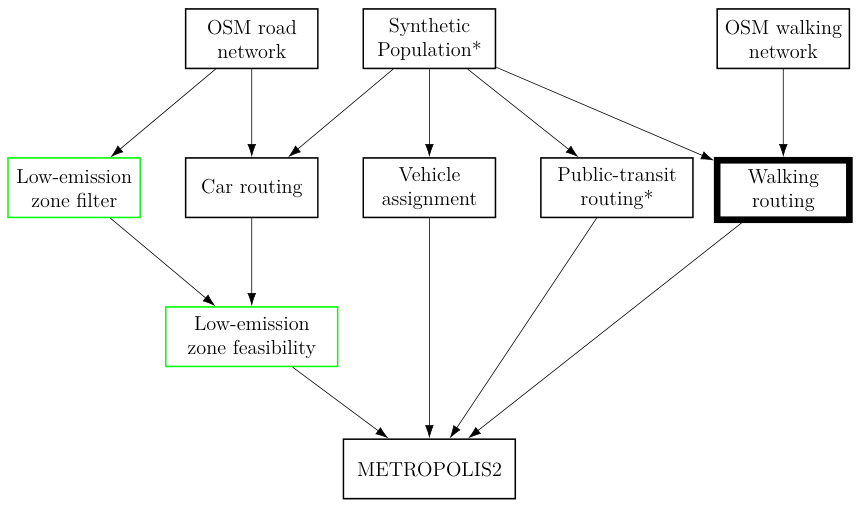
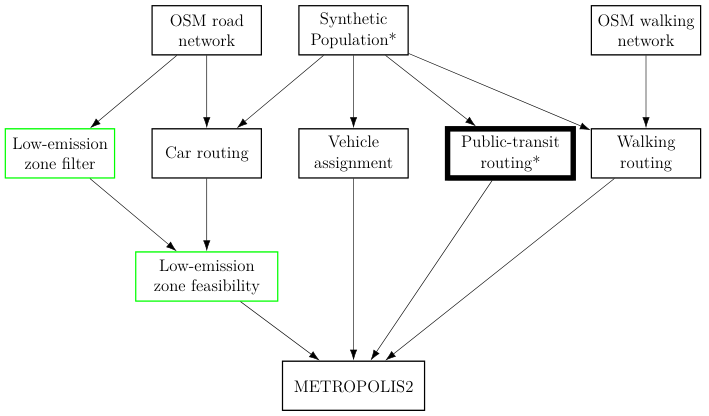
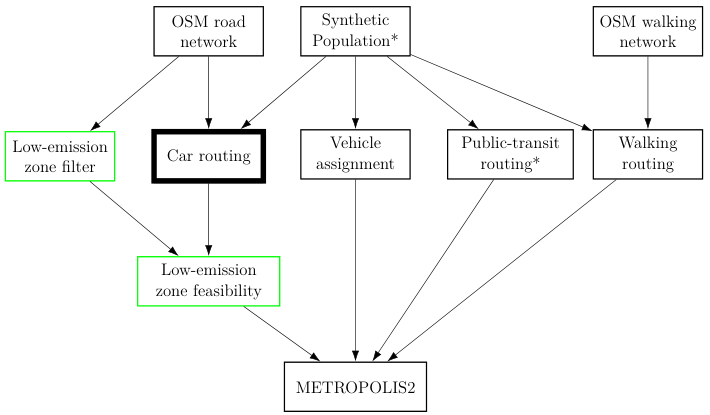
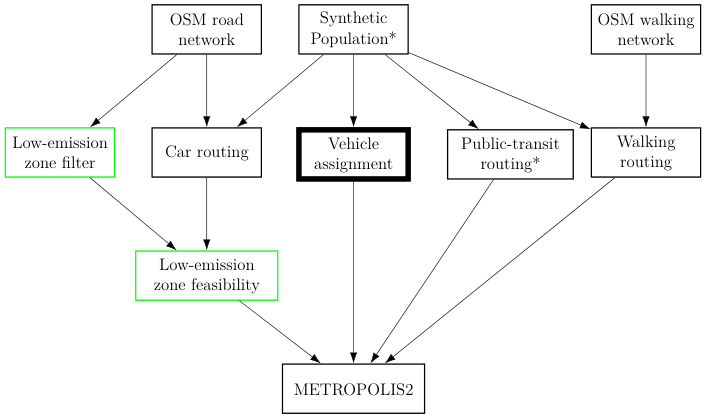
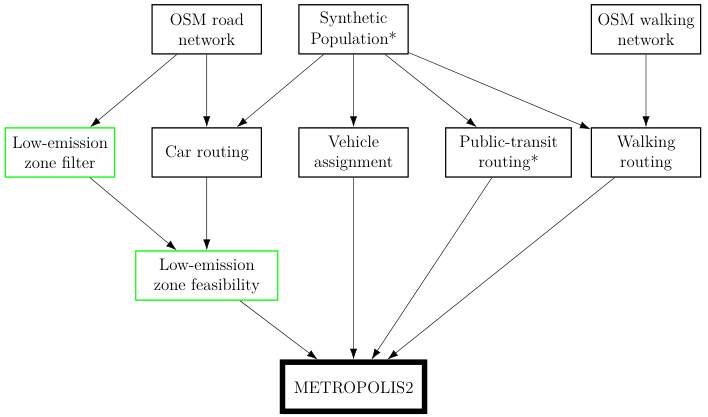
Workflow
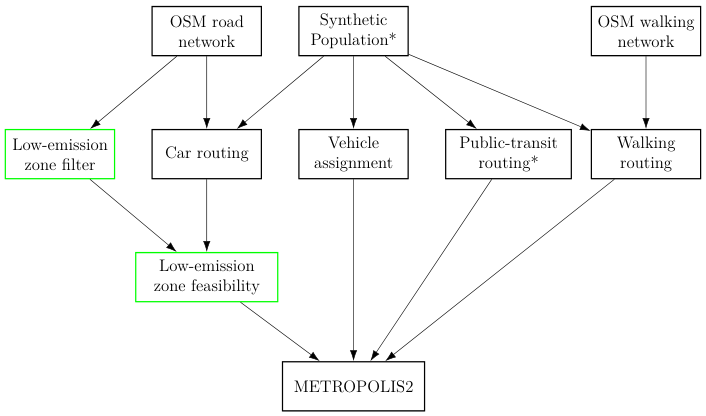
- Boxes are representing processing steps and arrows are representing dependencies.
- Asterisks * denote steps relying mainly on external libraries.
- Green: processing steps specific to the LEZ application
The Python codes for most of the processing steps presented today are available on the METROPOLIS' Python library
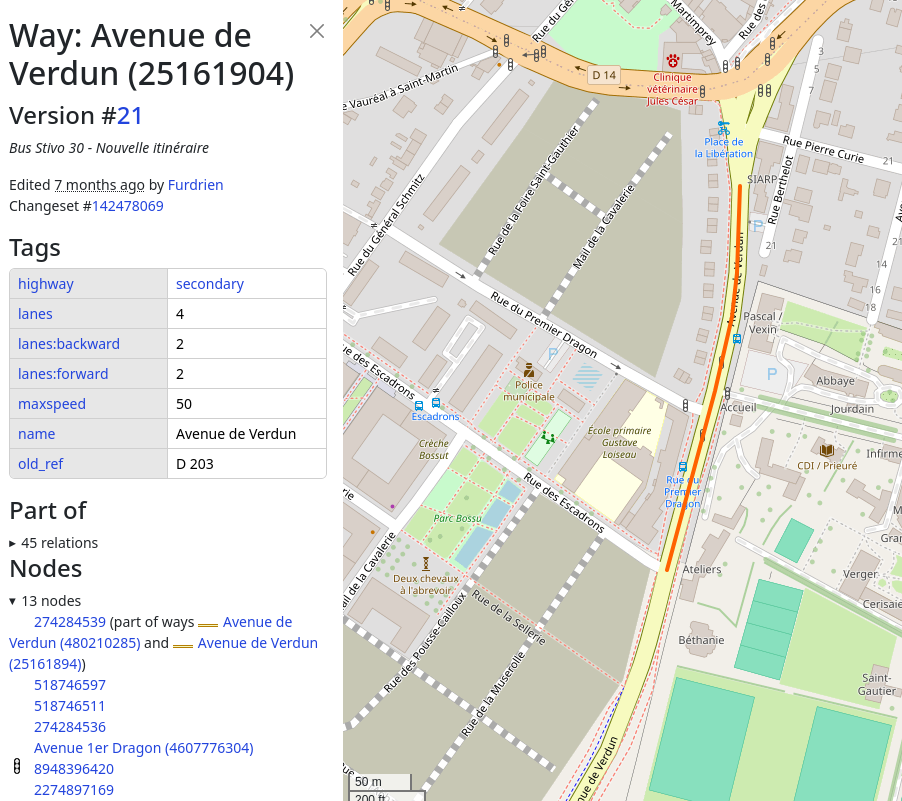
OpenStreetMap Network Import (1/8)
- Goal: Create road / walking network
- Methodology: Import and clean links from OpenStreetMap data
- Data:
.osm.pbffile for Île-de-France downloaded from GeoFabrik
OpenStreetMap Network Import (2/8)
- Discard the roads without a valid highway tag (valid tags for road network: motorway, trunk, primary, secondary, tertiary, living_street, residential, unclassified)
- Discard the roads for which access is not allowed for cars (access tag)
- Bidirectional roads are split in two opposite unidirectional roads (oneway tag)
- Speed limit and number of lanes are read from the data, whenever the information is available
- Roads are split in multiple segments when there are intersections between the two endpoints of the road
- Road length is computed from the road coordinates
- Unique ids are created to identify the roads
OpenStreetMap Network Import (3/8)
- Roads are classified as either urban or rural (urban areas are areas whose land_use tag is commercial, industrial, residential, retail, education)
- Roads which are part of a roundabout are flagged (junction tag)
- Roads with traffic signals, stop signs or give-way signs are flagged (highway tag of the road nodes)
OpenStreetMap Network Import (4/8)
- Default values are set to speed limit for edges with unspecified speed limit (based on their road type and whether they are urban or rural)
- Default values are set to the number of lanes for edges with unspecified number of lanes (based on their road type)
- Minimum values are set for the number of lanes (0.5), speed limit (10 km/h) and length (1 m)
- The edges which are not part of the largest strongly connected component of the graph are removed
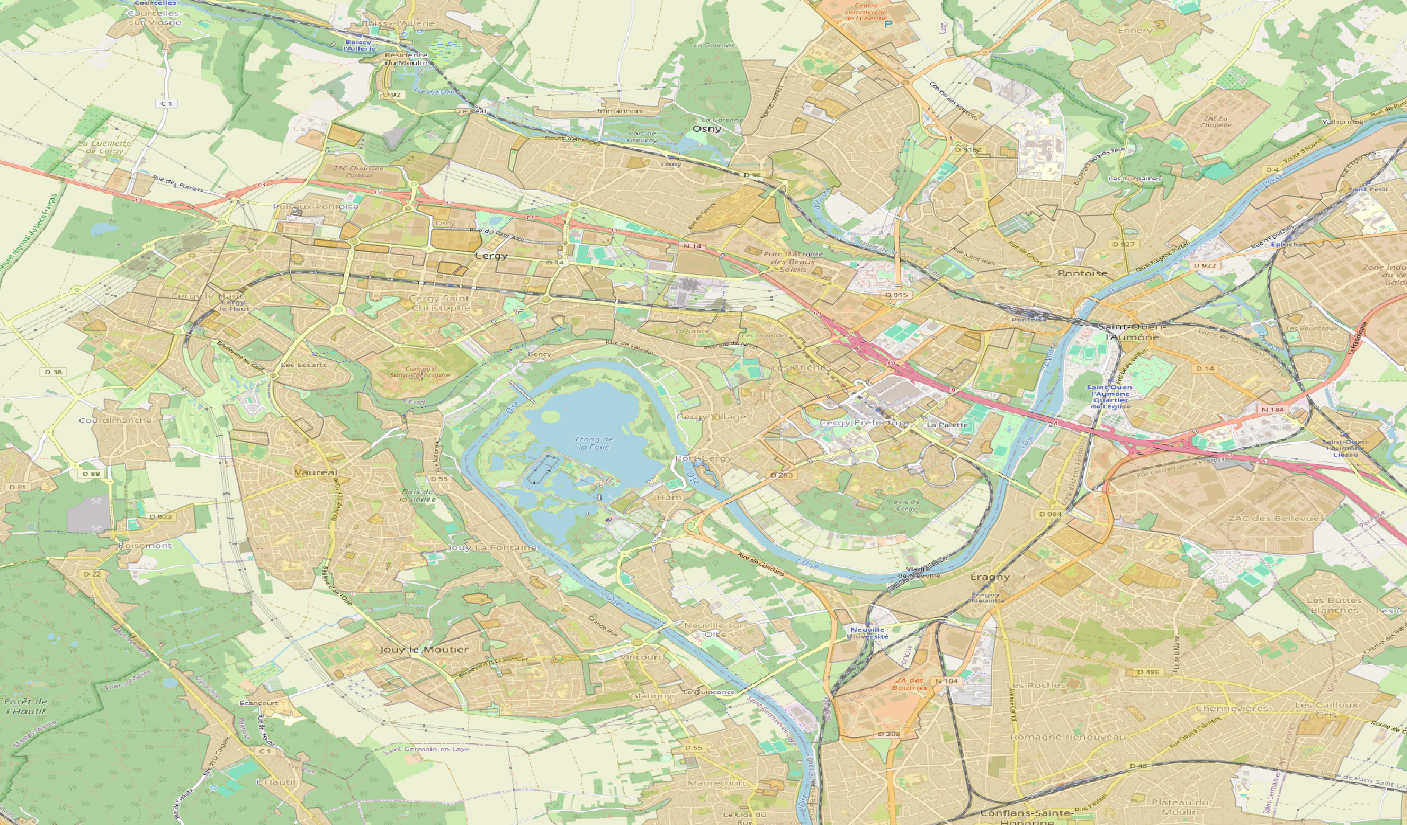
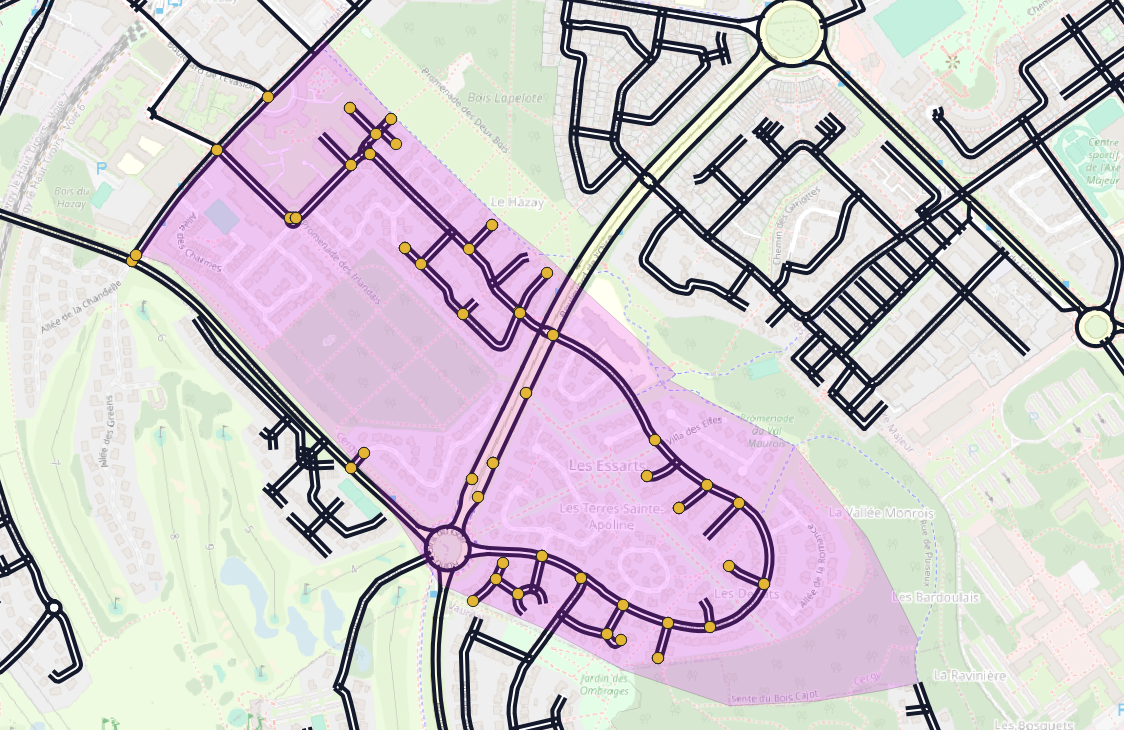
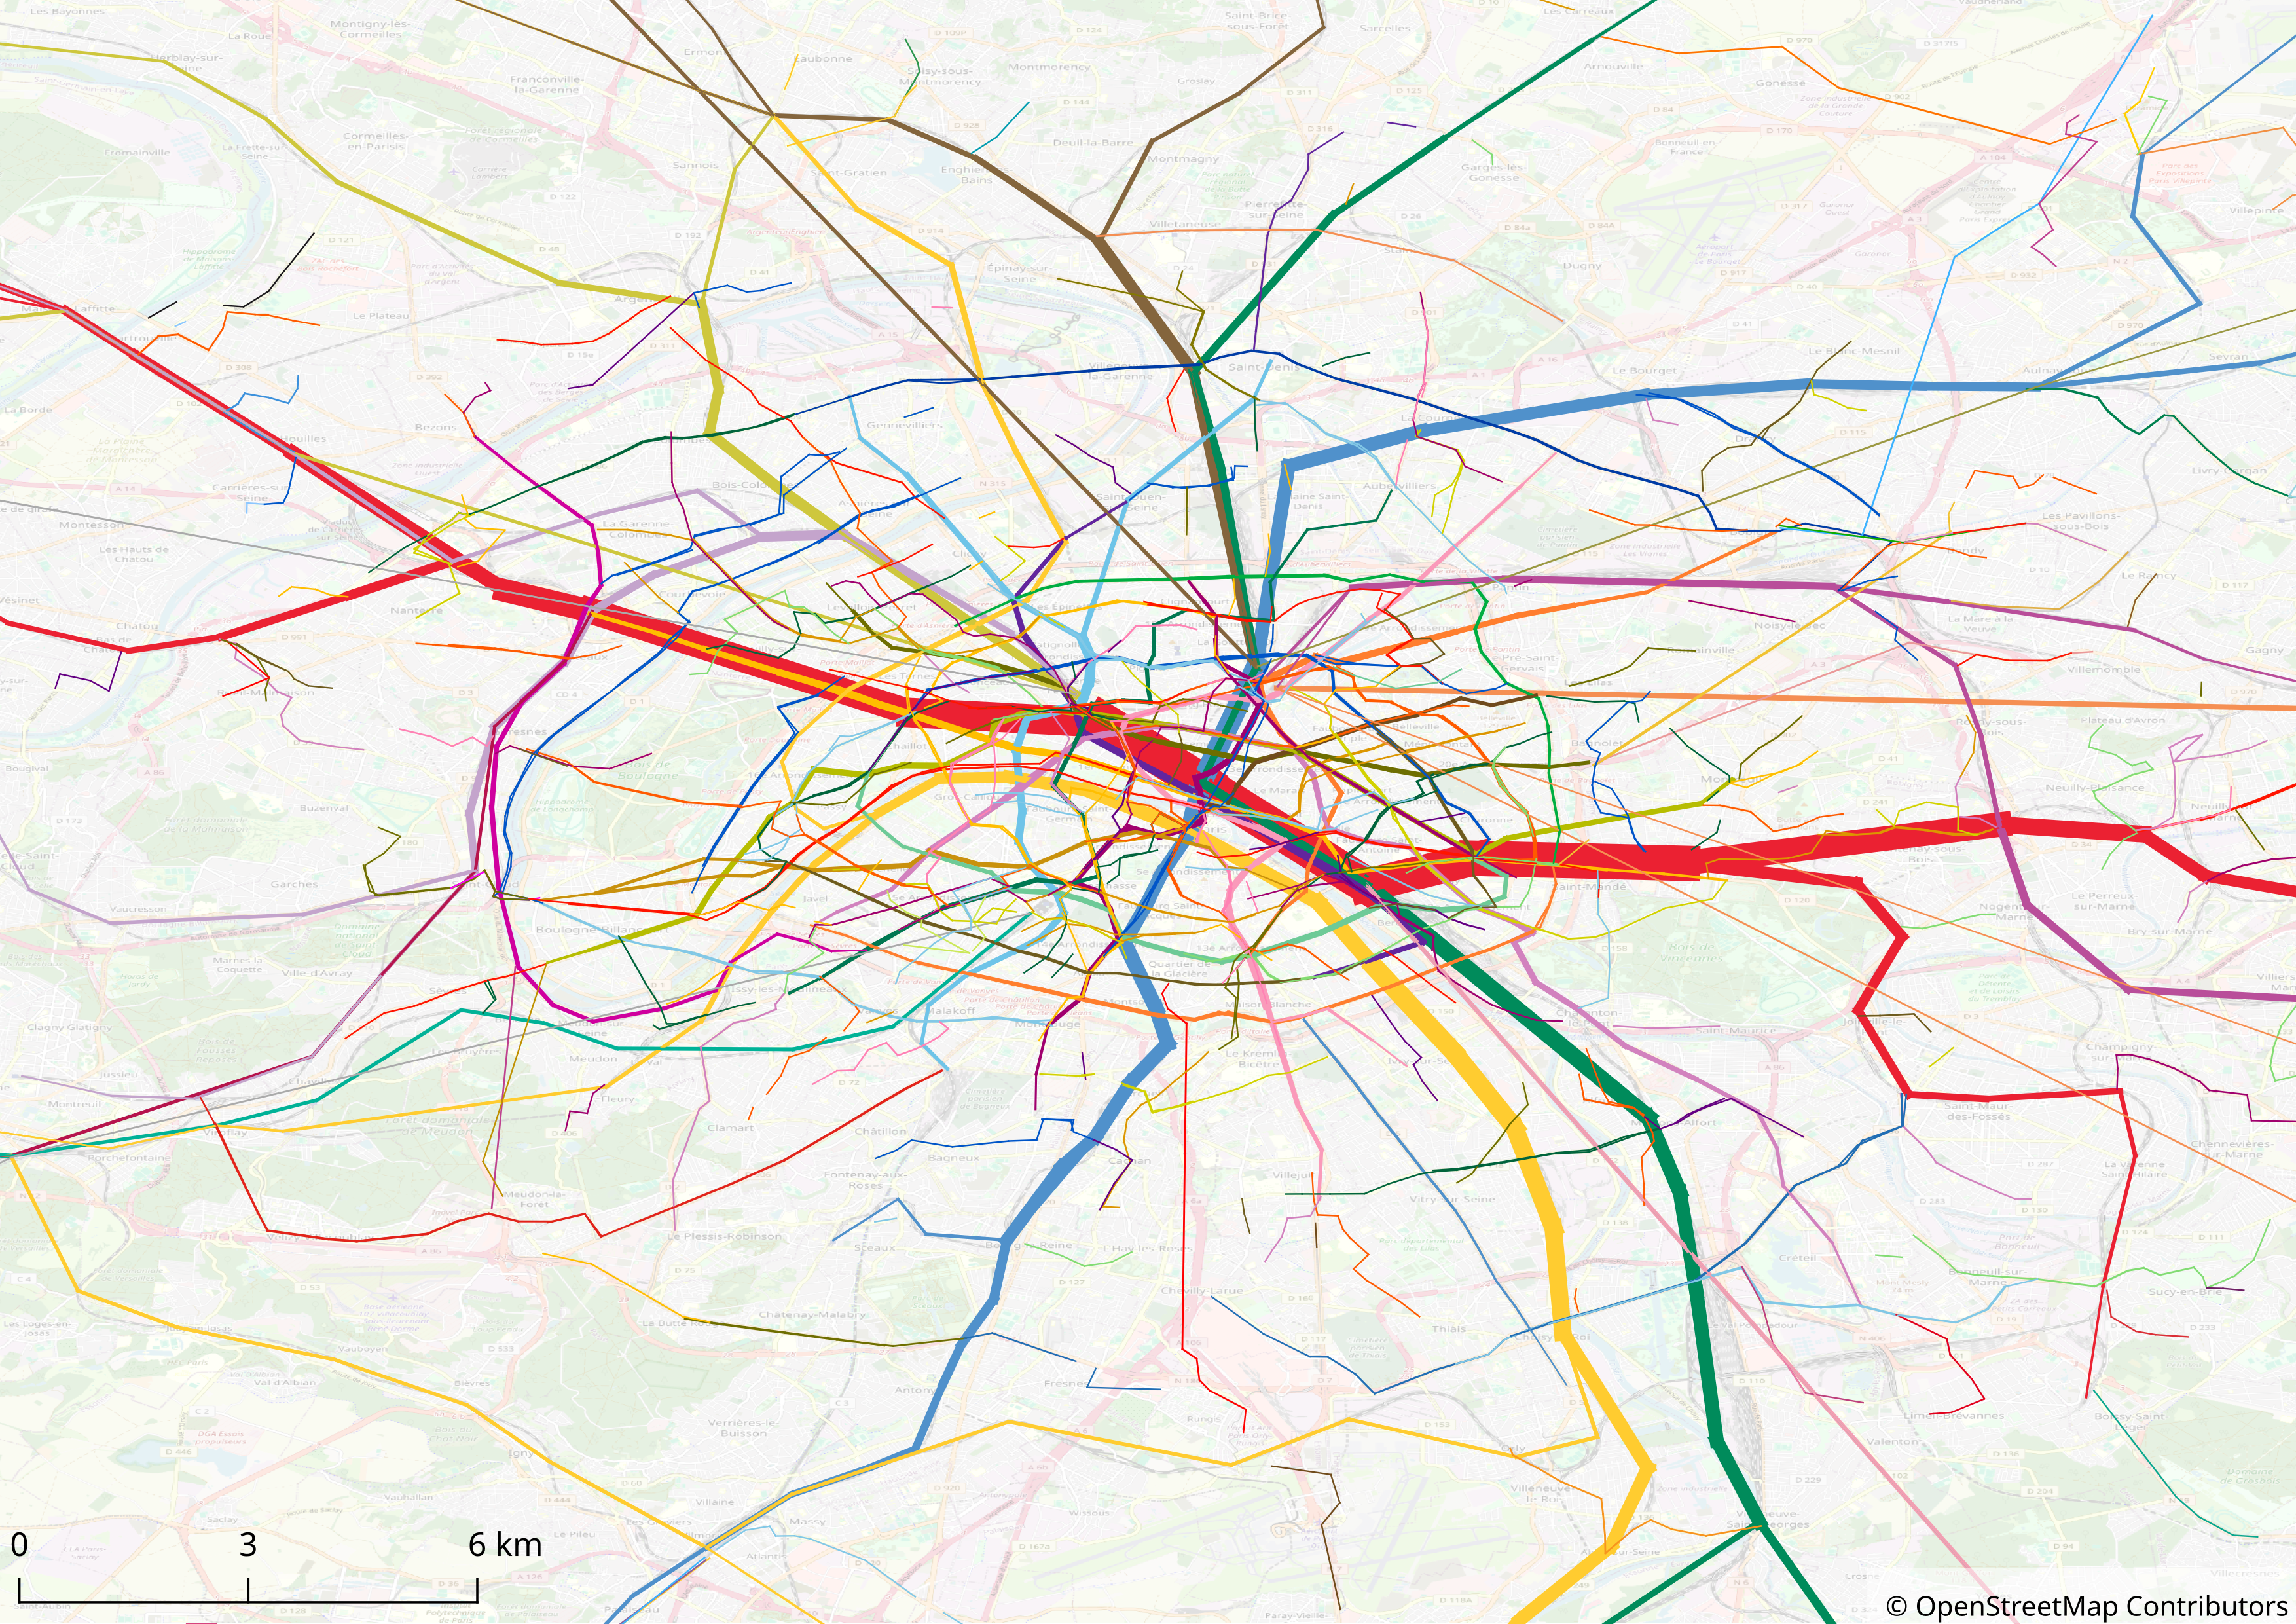
OpenStreetMap Network Import (5/8)
Road network map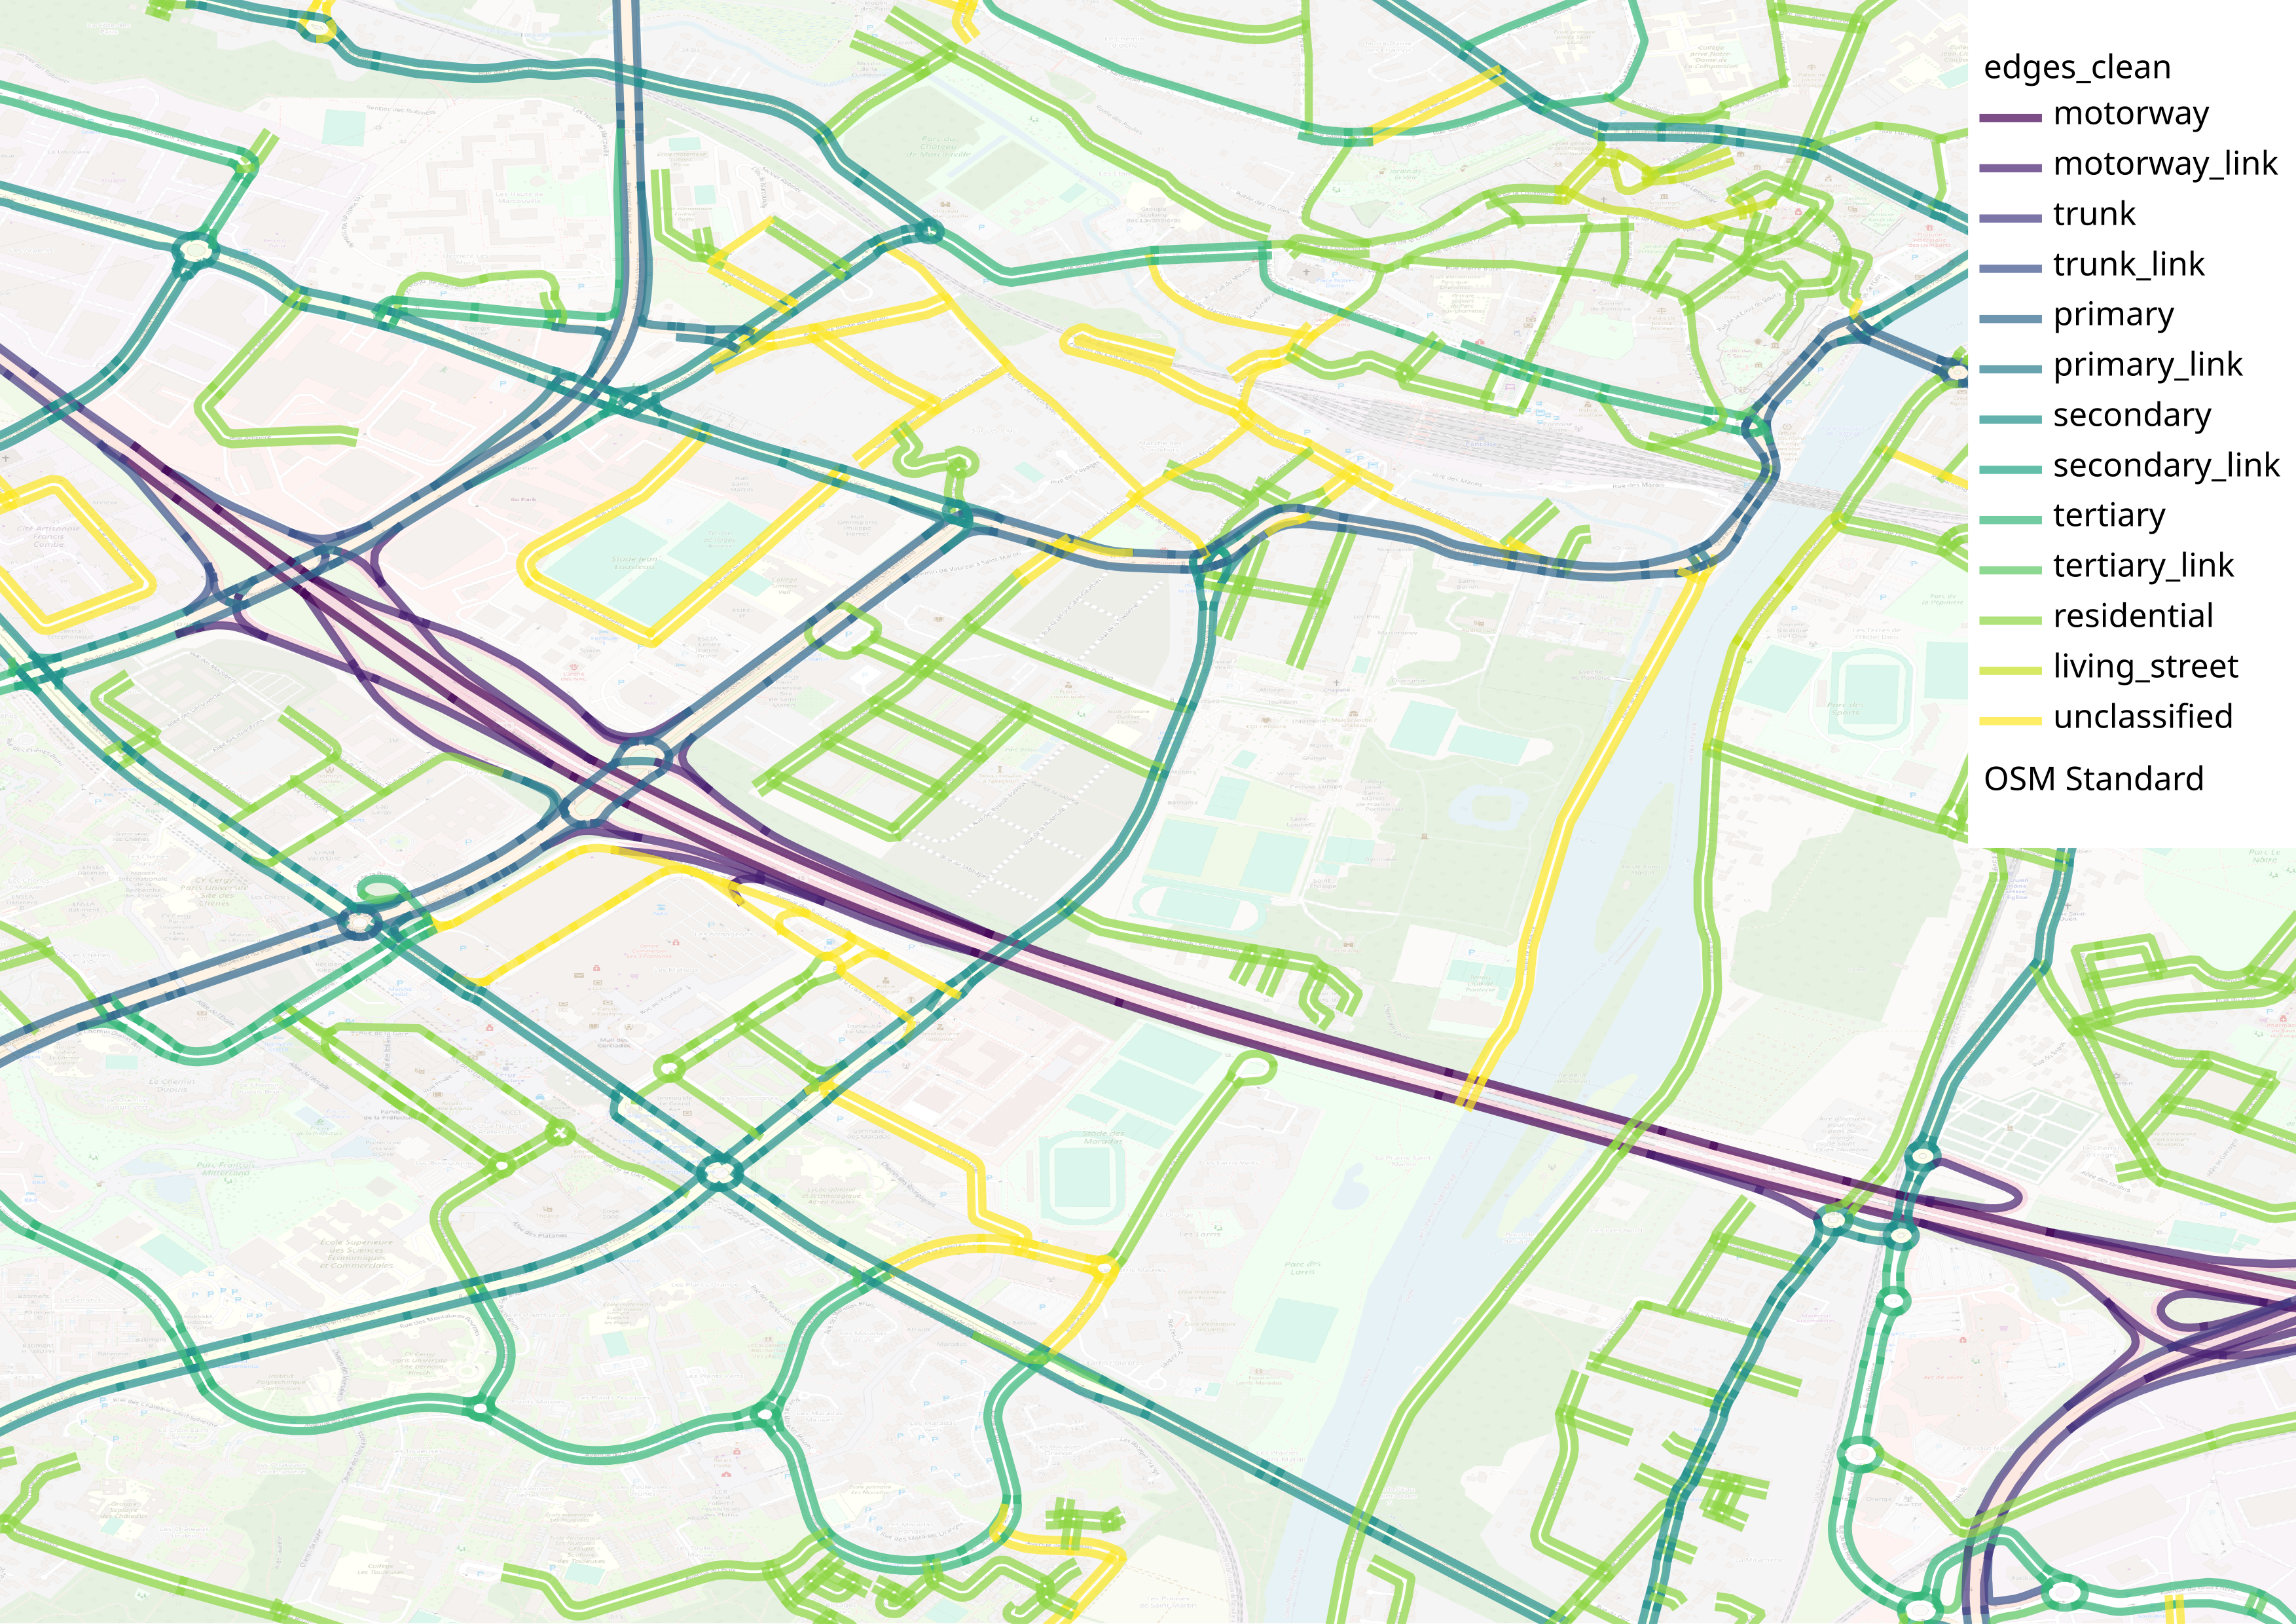
OpenStreetMap Network Import (6/8)
Walking network map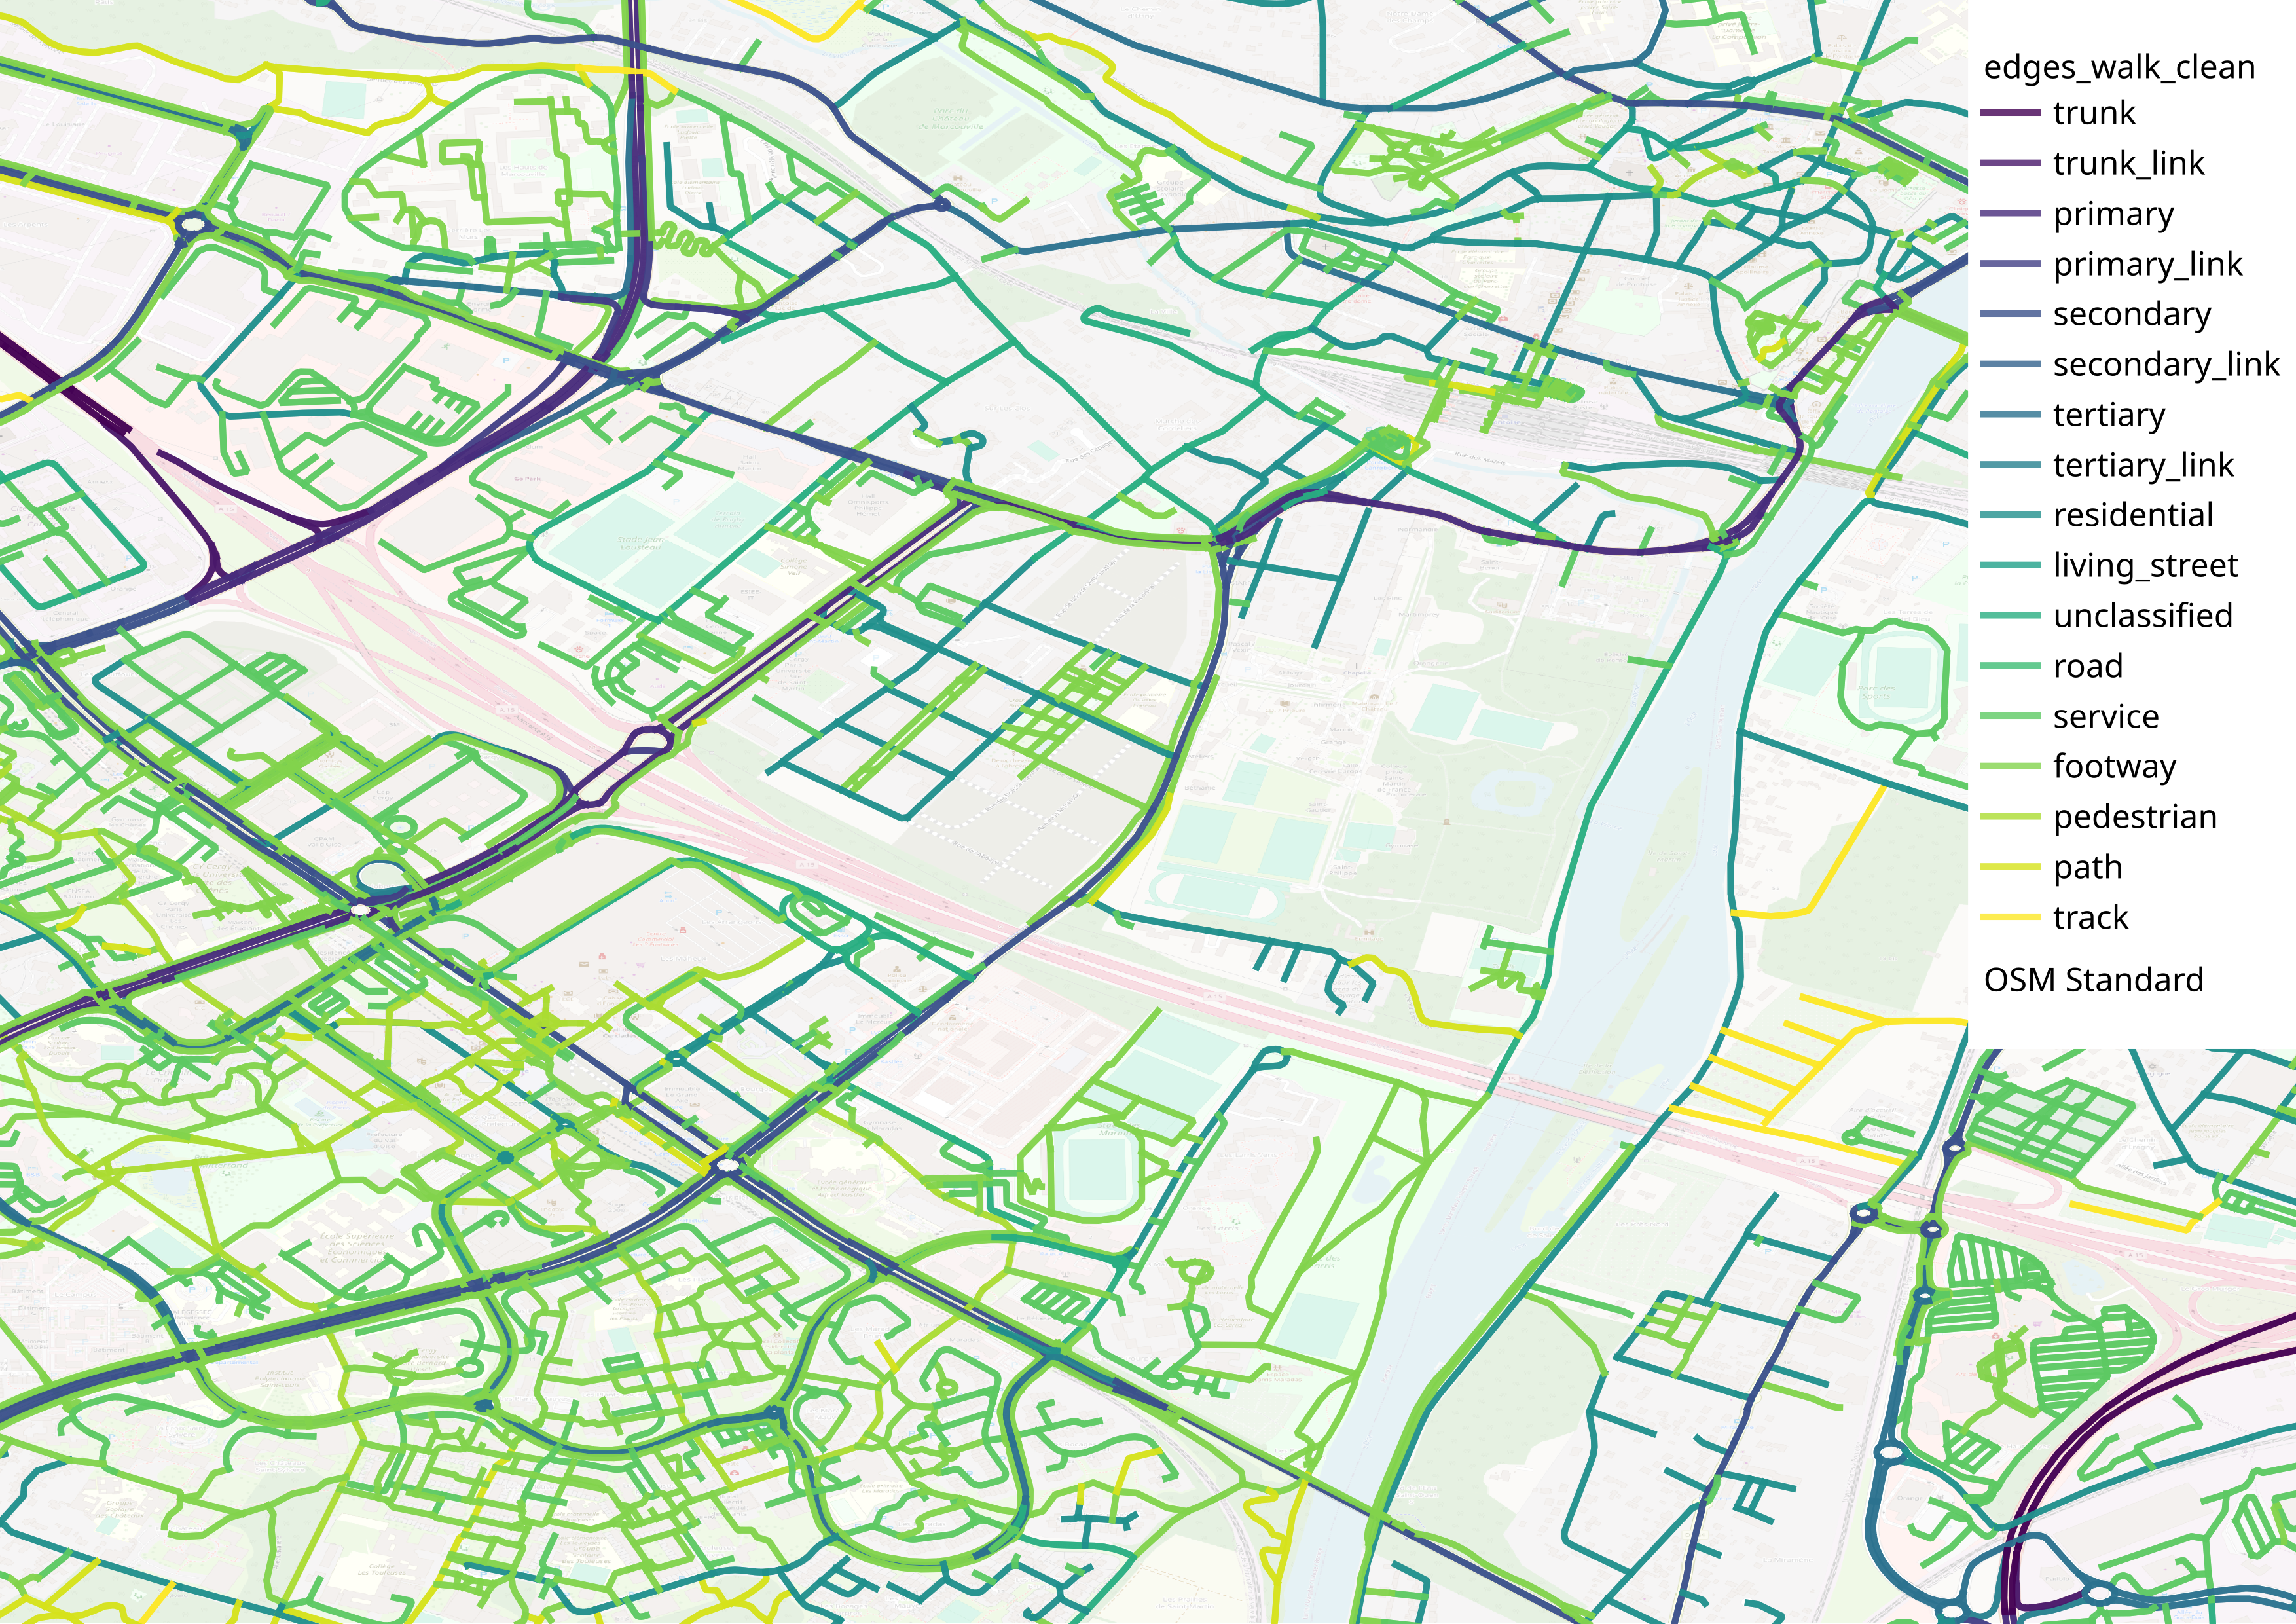
OpenStreetMap Network Import (7/8)
Road network statistics| Variable | Value | Share of total |
|---|---|---|
| # nodes | 294,706 | 100 % |
| # edges | 606,889 | 100 % |
| # urban edges | 532,234 | 87.7 % |
| # rural edges | 74,665 | 12.3 % |
| # roundabout edges | 27,393 | 4.5 % |
| # edges with traffic signals | 27,064 | 4.5 % |
| # edges with stop sign | 14,247 | 2.3 % |
| # edges with give-way sign | 7,867 | 1.3 % |
| Total kilometers | 72,453 | 100 % |
| Total kilometers (urban) | 46,614 | 64.3 % |
| Total kilometers (rural) | 25,839 | 35.7 % |
OpenStreetMap Network Import (8/8)
| Variable | Value |
|---|---|
| # nodes | 1,003,920 |
| # edges | 2,683,418 |
| Total kilometers | 187,680 |
Synthetic Population (1/6)
- Goal: Create agents with trips to be simulated
- Methodology: Synthetic population generation from Hörl and Balac Python code (generation of households, persons and trips), with some post-process cleaning and conversion
Synthetic Population (2/6)
Data used to generate the synthetic population:
- Census data (INSEE)
- Travel survey (EGT 2010)
- Income data at the municipality level (Filosofi)
- Sub-municipality zoning system (IRIS)
- Firm-level location and characteristics (SIRENE)
- Building database (BD TOPO)
- ...
Synthetic Population (3/6)
Synthetic Population (4/6)
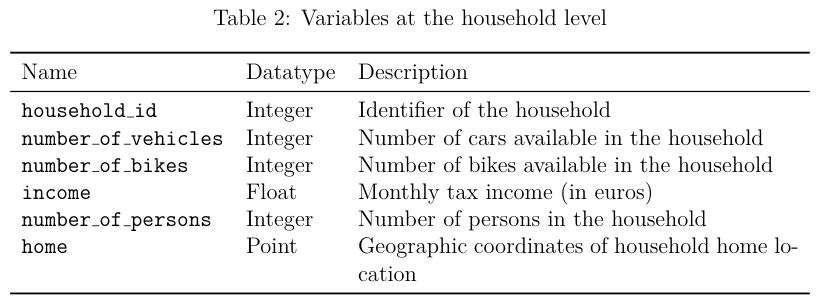
Example of household:
- Household id: 19
- Number of cars: 1
- Number of bikes: 0
- Income: 11 865 € / month
-
Persons:
Id Age Sex Socio-professional class 34 51 Man Employee 35 48 Woman Employee 36 17 Man Person without professional activity 37 13 Woman Person without professional activity
Synthetic Population (5/6)
Example of household (cont.):
-
Trips:
Id Person id Departure time Arrival time Preceding purpose Following purpose 133 34 07:52:56 08:41:56 Home Work 134 34 19:01:56 19:41:56 Work Home 135 35 07:26:03 07:46:03 Home Work 136 35 17:56:03 18:26:03 Work Home 137 36 09:49:46 09:54:46 Home Education 140 36 16:49:46 17:09:46 Education Home 141 36 17:49:46 18:04:46 Home Leisure 142 36 19:04:46 19:19:46 Leisure Home 143 37 08:03:12 08:08:12 Home Education 144 37 16:31:12 16:34:12 Education Home
Synthetic Population (6/6)
Example of household (Id 19):
A Note on Origin-Destination Matrices
Origin-destination matrices can be used instead of a synthetic population, with two options:
- Create centroids and connectors for trip starts / ends
- Spread the start / end points over nodes in the zone
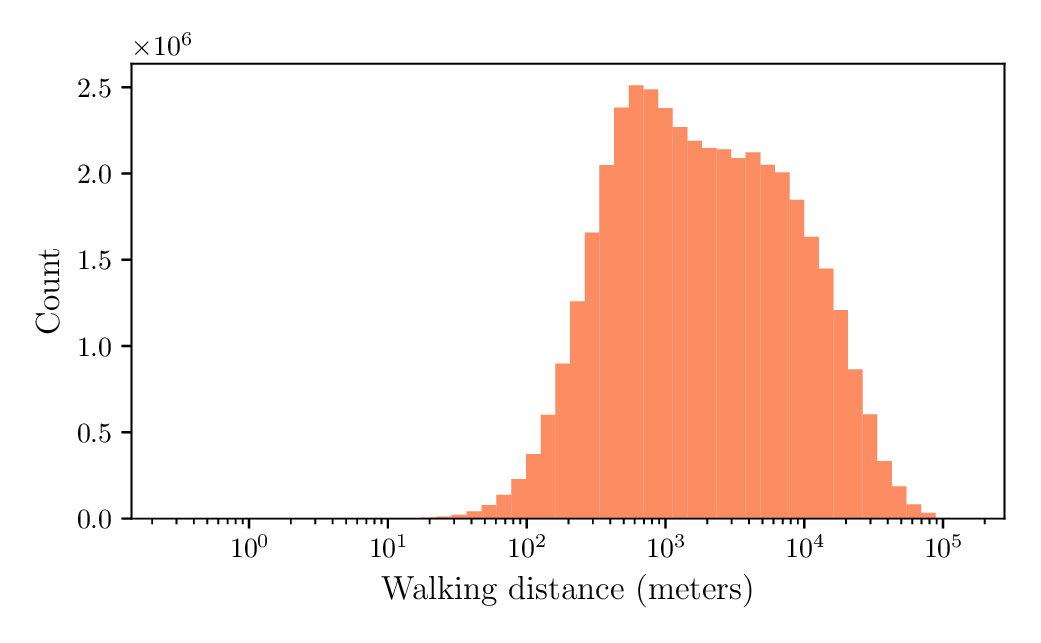
Walking Routing (1/4)
- Goal: Computing origin-to-destination walking distance for all trips
- Methodology: Use of METROPOLIS2 routing algorithm with the OpenStreetMap walking network
Walking Routing (2/4)
For each trip, the origin / destination points are matched to the nearest node (source / target) of the nearest edge of the network
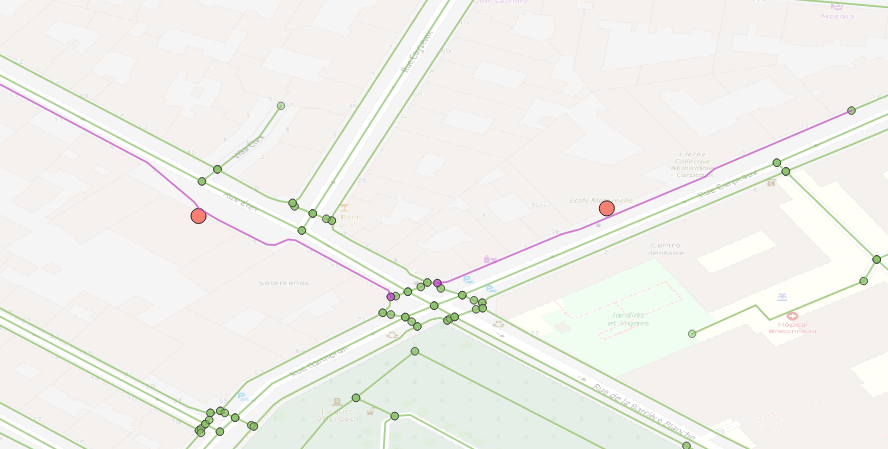
Walking Routing (3/4)
Distance from origin to the nearest node
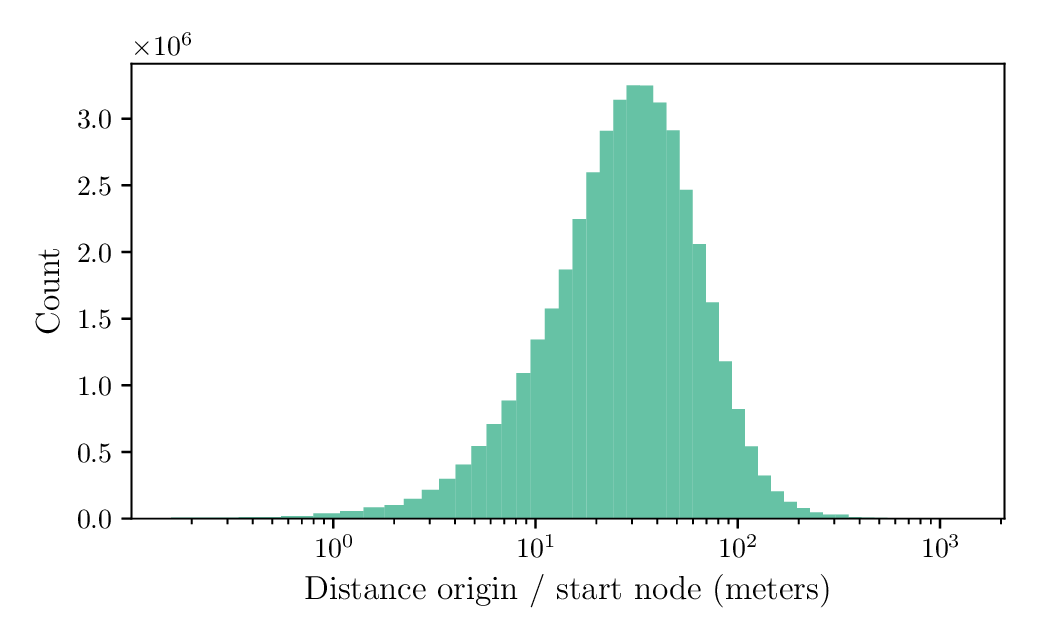
Walking Routing (4/4)
The trip distance (in meters) is computed by running METROPOLIS2's routing algorithm on the OSM walking network previously imported
Public-Transit Routing (1/7)
- Goal: Computing origin-to-destination public-transit travel time for all trips
- Methodology: Use of the OpenTripPlanner open-source library, relying on OpenStreetMap data and GTFS files
Public-Transit Routing (2/7)
Step 1: Install OpenTripPlanner and generate a graph
- Download Java and OpenTripPlanner executable
- Download OpenStreetMap and GTFS data (GTFS: description of public-transit schedules for an area, available freely almost everywhere)
-
Build and save an OTP graph:
java -Xmx2G -jar otp-2.5.0-shaded.jar --build --save . -
Start the OTP server:
java -Xmx2G -jar otp-2.5.0-shaded.jar --load --serve .
This will make a web API available on the local network to request origin-destination least cost paths
Public-Transit Routing (3/7)
Step 2: Compute public-transit travel time and path for all trips in the synthetic population
- Trips' origin / destination coordinates can be used directly as input to OpenTripPlanner
- The path with smallest generalized cost is selected, among all paths that start within 15 minutes of the trip's departure time (for a standard working day)
-
Generalized cost:
- waiting is 10 % more costly than being in a vehicle
- walking is 100 % more costly than being in a vehicle
- boarding a vehicle is equivalent to being in a vehicle for 5 minutes
- being in a bus is 20 % more costly than being in a vehicle (rail, subway or tram)
- Walking speed is 4 km/h
Public-Transit Routing (4/7)
| Trip id | Person id | Travel time | Walk only? |
|---|---|---|---|
| 133 | 34 | 01:01:31 | No |
| 134 | 34 | 00:57:58 | No |
| 135 | 35 | 00:27:32 | No |
| 136 | 35 | 00:32:27 | No |
| 137 | 36 | 00:09:31 | Yes |
| 140 | 36 | 00:09:29 | Yes |
| 141 | 36 | 00:05:33 | Yes |
| 142 | 36 | 00:05:33 | Yes |
| 143 | 37 | 00:01:56 | Yes |
| 144 | 37 | 00:01:56 | Yes |
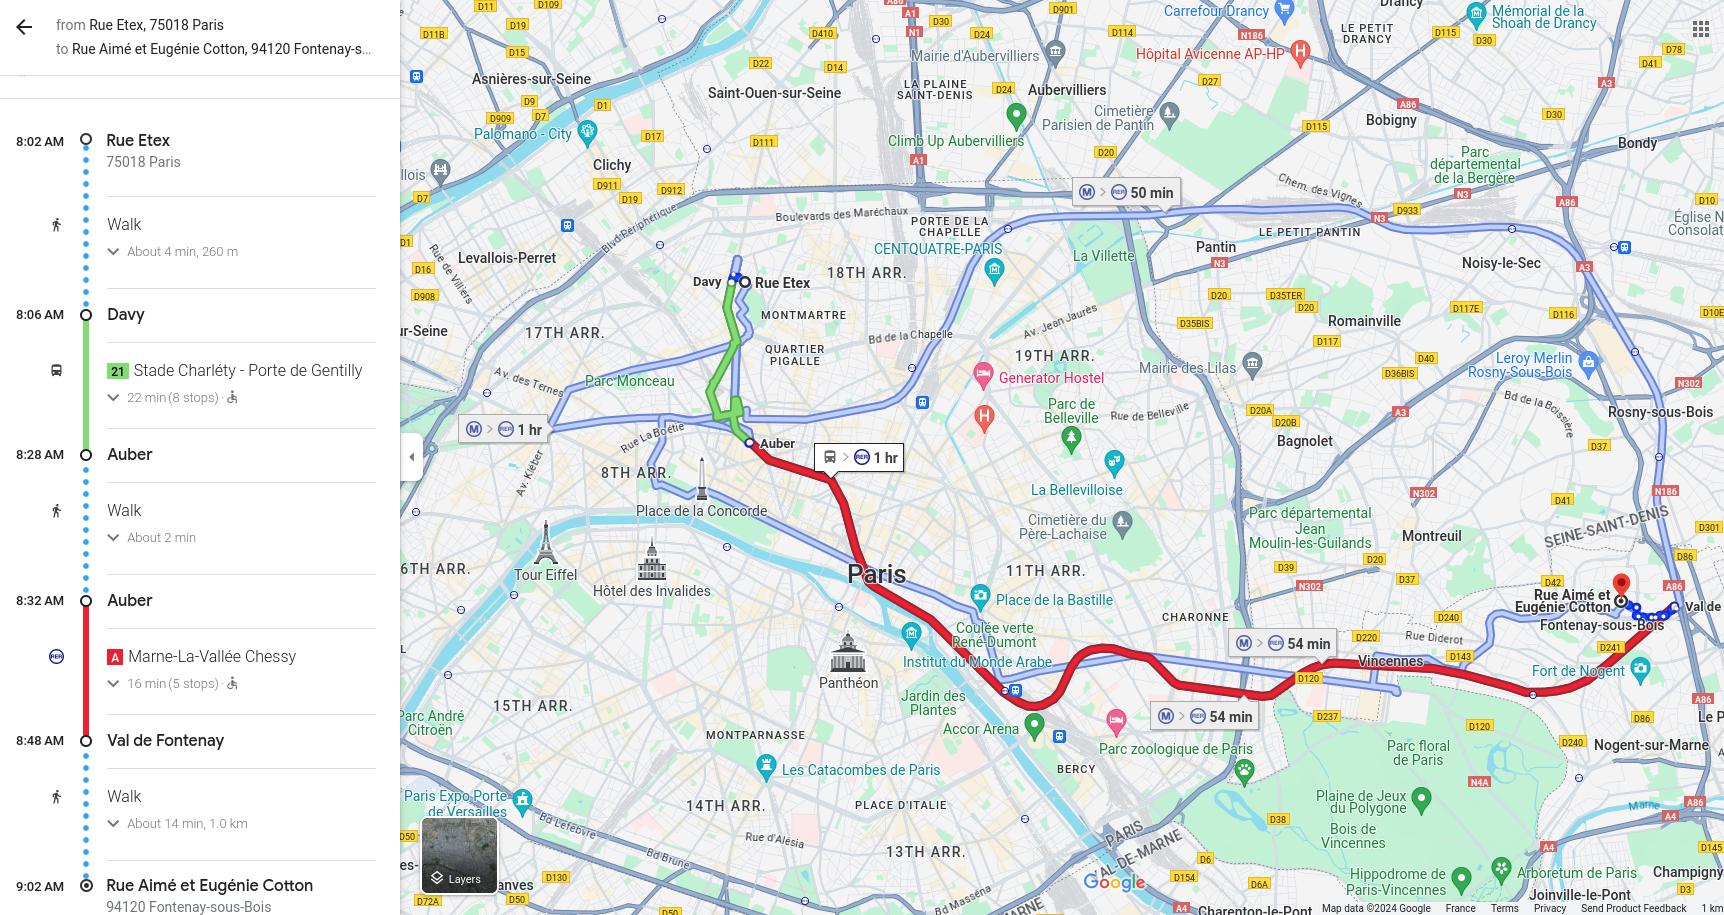
Public-Transit Routing (5/7)
Trip 133 (OpenTripPlanner):
- Walk 4m33s to stop Davy
- Take Bus 21 from Davy to Auber (20m)
- Walk 2m8s to Auber RER
- Take RER A from Auber RER to Val de Fontenay (16m2s)
- Walk 14m50s to destination
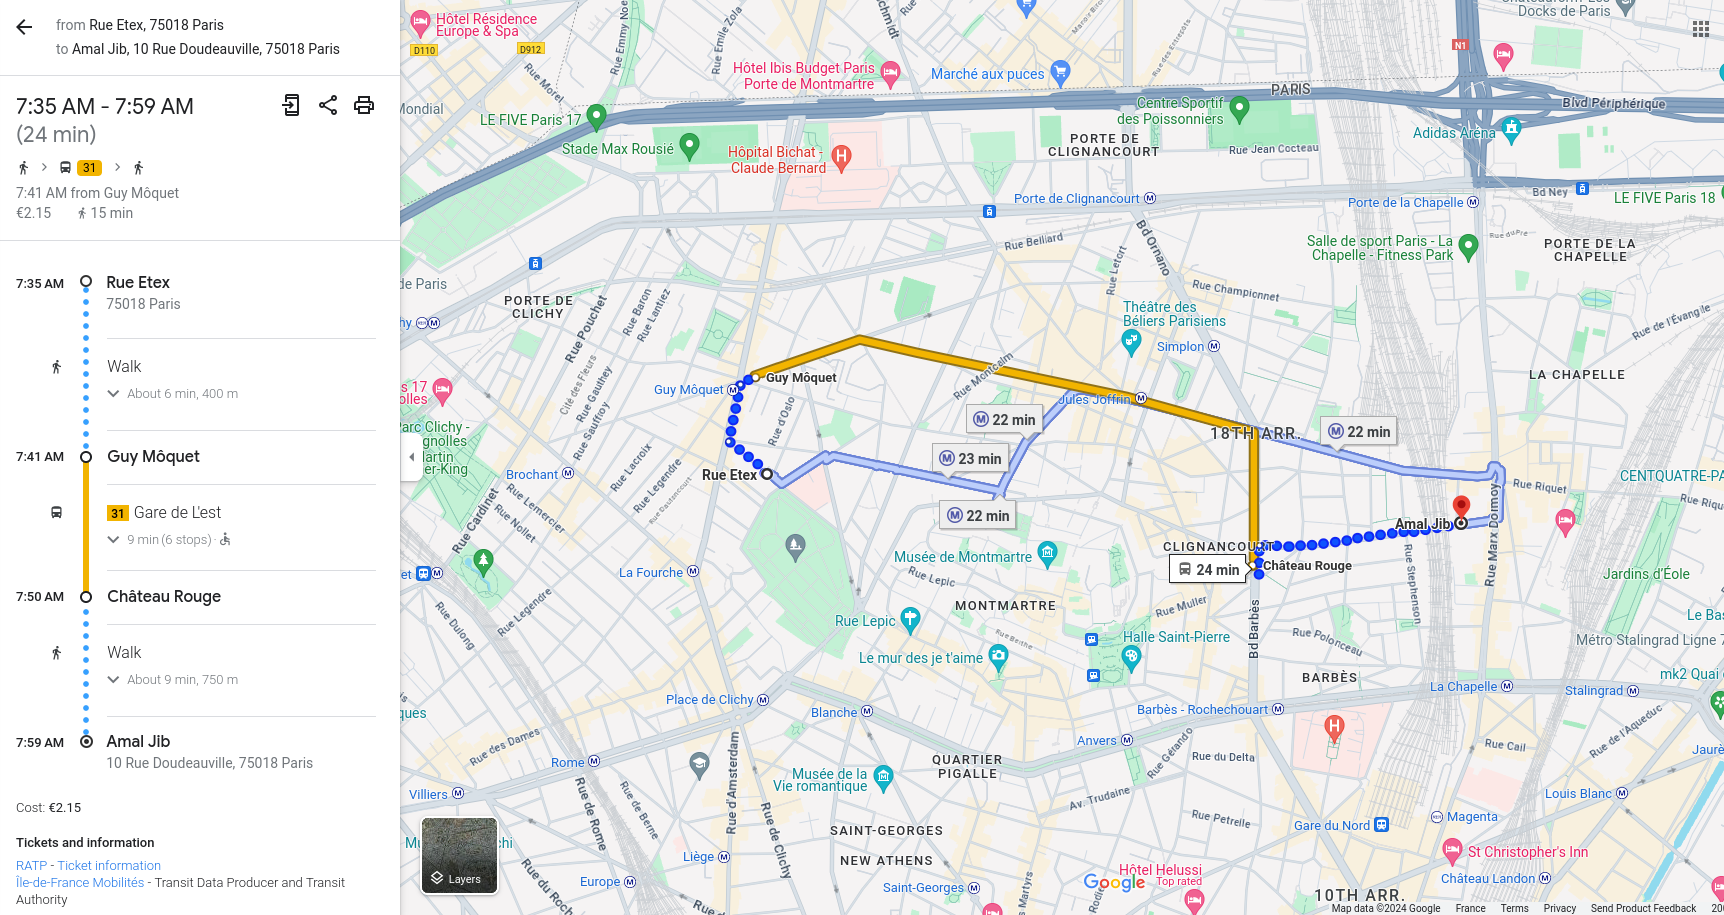
Public-Transit Routing (6/7)
Trip 135 (OpenTripPlanner):
- Walk 6m42s to stop Guy Môquet
- Take Bus 31 from Guy Môquet to Château Rouge (8m)
- Walk 12m50s to destination
Public-Transit Routing (7/7)
Stop-to-stop public-transit flows
Car Routing (1/3)
- Goal: Find start / end node to be used in METROPLIS2 for the road trips
- Methodology: Match origin / destination to the nearest node of the OpenStreetMap road network; remove the parts of the trips on the residential network
Car Routing (2/3)
For each trip, the origin / destination points are matched to the nearest node (source / target) of the nearest edge of the network
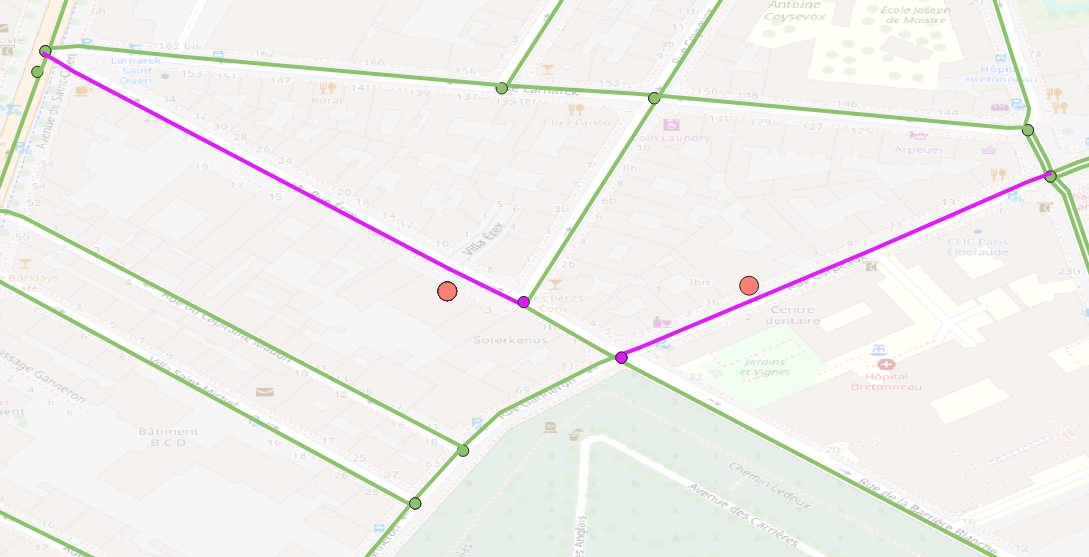
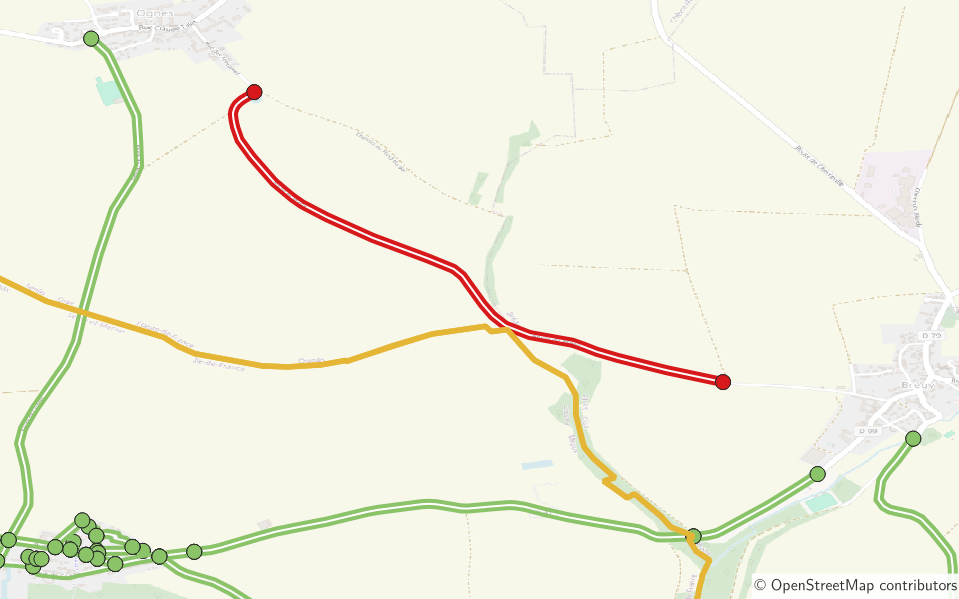
Car Routing (3/3)
Optional, extra steps:
- Split the edges of the road network between main and secondary
- Compute the fastest (uncongested) route from origin to destination
- Remove the access / egress part of the route done on the secondary edges
- Remove the secondary edges from the simulation
This speeds up significantly the simulation but assumes that the secondary edges are always uncongested
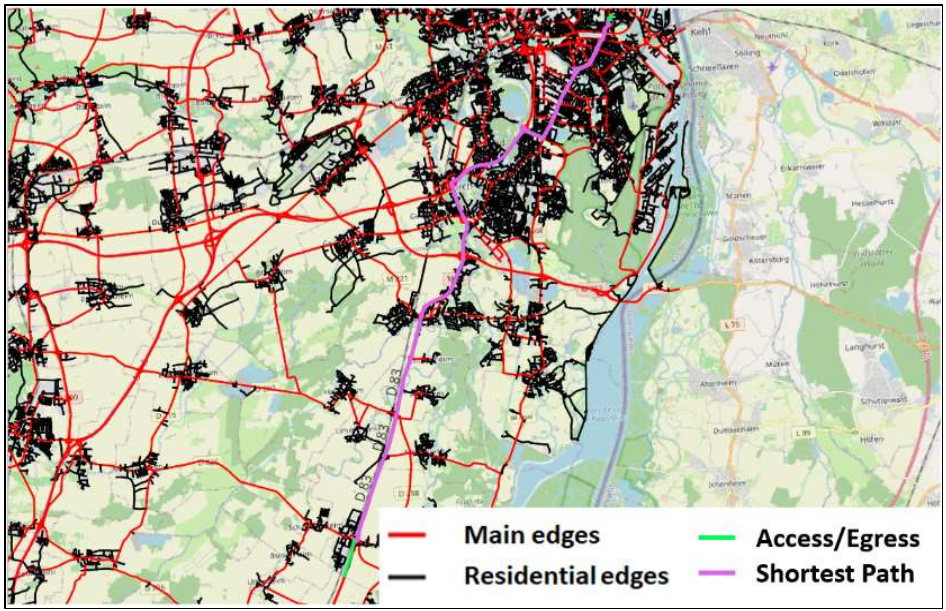
Credit: Théotime Kuhn
Vehicle Assignment (1/3)
- Goal: Assign vehicles to the households, with fuel type and Crit'air
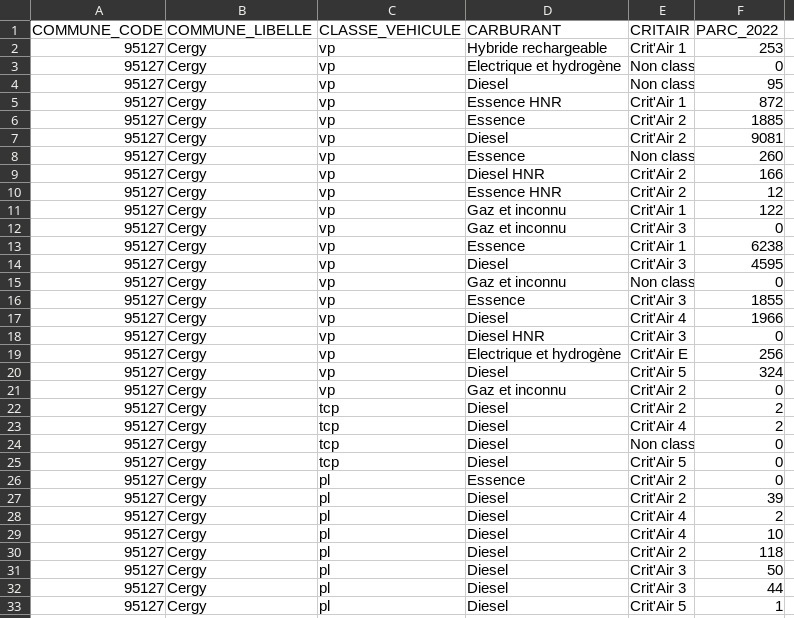
- Methodology: Randomly draw a vehicle from the vehicle fleet data at the municipality level
Vehicle Assignment (2/3)
- Find in which municipality the household home is located
- Retrieve the vehicle fleet data for this municipality
- Draw randomly as many vehicles as the household owns
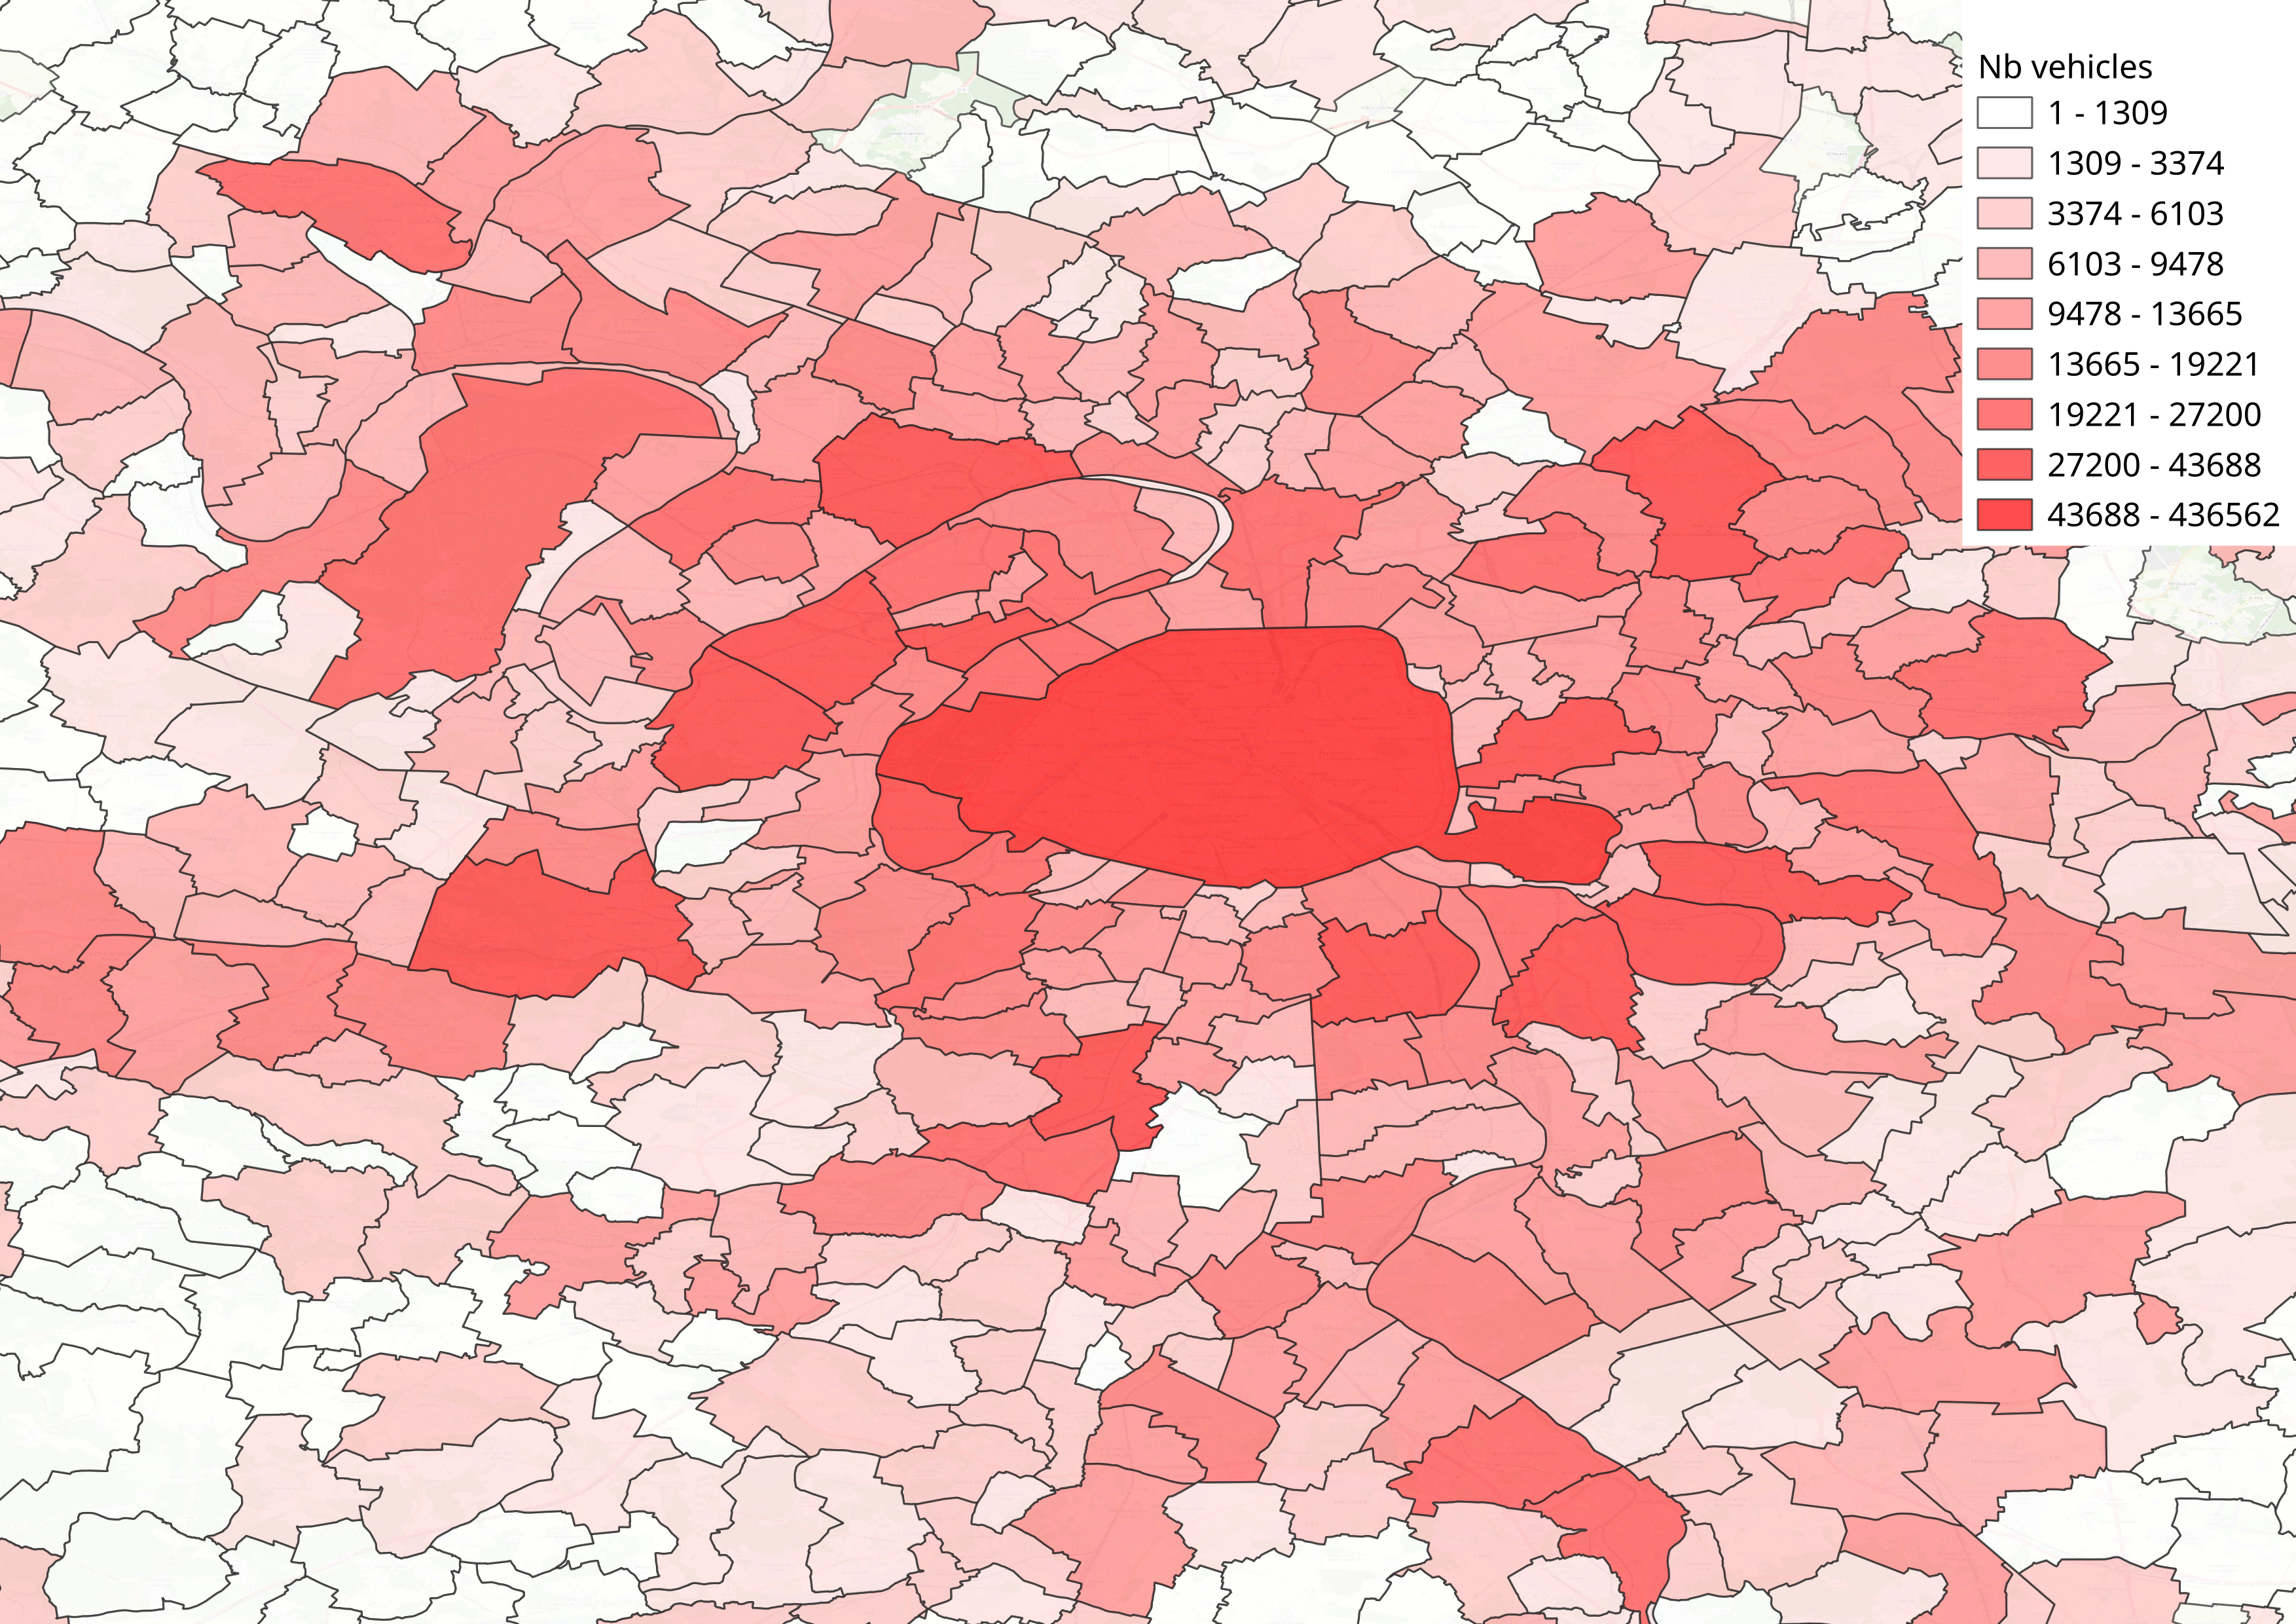
Vehicle Assignment (3/3)
METROPOLIS2 Input Generation (1/4)
- Goal: Generate the input files of the METROPOLIS2 simulator
- Methodology: Make some assumptions for the values not computed yet
METROPOLIS2 Input Generation (2/4)
Road network
What is known:
- Id, source, target
- Length, number of lanes
What is not known:
- Free-flow speed (equal to speed limit? calibrated?)
- Constant travel time penalty (calibration of free-flow travel times)
- Bottleneck capacity and speed-density function parameters (calibration of congested travel times)
METROPOLIS2 Input Generation (3/4)
Agents / Alternatives
What is known:
- Agent id
- Mode / alternative availability (vehicle ownership, driving license, public-transit feasibility)
What is not known:
- Alternative id (e.g., 0: walking, 1: car, 2: public transit)
- Alternative-choice model (calibration of mode choice)
- Departure-time choice model (calibration of departure-time choice)
METROPOLIS2 Input Generation (4/4)
Trips
What is known:
- Trip id
- Origin / destination / vehicle for road trips
- Travel time for walking / public-transit trips
- Stopping time (activity duration)
What is not known:
- Mode-specific travel utility constant and value of time (calibration of mode choice)
- Schedule utility desired arrival time and early / late penalties (calibration of departure-time choice)